If you do not have either the Field Service Management and/or Driveri solutions added to your account and you click on either option from the App Switcher, you are redirected to a landing page to learn more about the applicable solution add-on.
Using the App Switcher
How to use the App Switcher:
From the Portal, click the App Switcher button ().
A drop-down menu appears.
Click the application you would like to use.
The selected application opens.
We offer Single Sign On (SSO) for customers with the Driveri platform who would like users to be automatically signed in to the platform upon clicking the Driveri option from the App Switcher. To enable SSO for your account, please contact your Account Manager.
Managing Application Access - Driveri
For customers with the Driveri solution add-on who have enabled SSO, users with Admin permissions can easily and quickly view and manage user application access from the Admin page. Please visit [solution term="standard"]Using Application Access[/solution][solution term="pro,enterprise"]Managing Application Access[/solution] for additional information.
[post_title] => About the App Switcher
[post_excerpt] => This article provides information about the App Switcher available on the Map page of the Portal.
[post_status] => publish
[comment_status] => closed
[ping_status] => closed
[post_password] =>
[post_name] => about-the-app-switcher
[to_ping] =>
[pinged] =>
[post_modified] => 2025-01-28 10:11:44
[post_modified_gmt] => 2025-01-28 17:11:44
[post_content_filtered] =>
[post_parent] => 0
[guid] => https://help.gpsinsight.com/?post_type=documentation&p=25065
[menu_order] => 0
[post_type] => documentation
[post_mime_type] =>
[comment_count] => 0
[filter] => raw
)
[1] => WP_Post Object
(
[ID] => 31953
[post_author] => 12
[post_date] => 2025-02-07 08:28:16
[post_date_gmt] => 2025-02-07 15:28:16
[post_content] =>
The Camera Media page in the Fleet Tracking Portal is designed to provide a centralized and focused repository of camera video clips from Driveri, Drive360, and AIR II cameras. Camera event clips are plotted on the map and you can access metadata about the vehicle’s behavior reported during the media clip’s timeframe.
Note: You must have the Camera Media permission enabled to see the Camera Media Library page in the Portal.
Accessing the Camera Media Page
To access the Camera Media Page, click the camera icon from the left-hand navigation bar in the Fleet Tracking Portal.
Filtering Camera Event Clips
You can filter camera event clips by event type, fleet subset, and time frame. Any filtering selections made are applied automatically.
Event Types
To filter by event type, click the Event type button and check the boxes next to the applicable type(s).
Note: Available event types vary depending on the camera, Driveri vs. AIR II/Drive360. If you filter by an event that is unavailable for your camera, you will not see any clips listed in the Results List.
Dangerous driving Distracted Driver initiated Drowsiness Follow distance Good driving Hard acceleration
Hard brake Hard turn Manual request Potential incident Seatbelt Speeding Violation
Fleet Subset
By default, the fleet subset selected is "Group" > "All Vehicles." To filter by fleet subset, click the expand button in the drop-down and click the applicable subset.
Note: The Hierarchy feature is available to Enterprise customers and customers with the Advanced Administration add-on. If you are interested in this feature, please contact your Account Manager.
Vehicle Group Vehicle Hierarchy Vehicle Driver
Time Frame
By default, the time frame displayed is "Today." To select a different time frame, click the expand button in the drop-down and click the application option to make your selection.
Today Yesterday Last 7 days
Last 30 days This month Custom range
Viewing the Results List
The Results list of camera clips displays entries based on selected filtering options. Each clip included in the list displays the vehicle label, clip name (editable), time of the day for the clip, and the type of clip event.
Note: If the clip was requested manually, the entry in the Results list displays a designation of "Manual."
You can adjust the display appearance of the Results list by clicking on the Expanded List icon. If you'd like to return to the default display appearance, click the Collapsed List icon.
Please see Using the Camera Page for step-by-step instructions on how to use each feature available from the Camera Media Page.
[post_title] => About the Camera Media Page
[post_excerpt] =>
[post_status] => publish
[comment_status] => closed
[ping_status] => closed
[post_password] =>
[post_name] => about-the-camera-media-page
[to_ping] =>
[pinged] =>
[post_modified] => 2026-08-07 13:28:00
[post_modified_gmt] => 2026-08-07 20:28:00
[post_content_filtered] =>
[post_parent] => 0
[guid] => https://help.gpsinsight.com/?post_type=documentation&p=31953
[menu_order] => 0
[post_type] => documentation
[post_mime_type] =>
[comment_count] => 0
[filter] => raw
)
[2] => WP_Post Object
(
[ID] => 21265
[post_author] => 12
[post_date] => 2020-11-03 09:25:25
[post_date_gmt] => 2020-11-03 16:25:25
[post_content] => The Portal interface is quick, simple, and highly configurable. With just a few clicks, you can run any report or view the map for a single vehicle, a group of vehicles, or your entire fleet. Schedule reports, set up alerts, or administer your vehicle, driver, and user groups easily from our efficient web-based interface.
Enterprise Driver and driver groups are only available with Enterprise. To learn more, contact your Account Manager.
You can also gain insight into your fleet via real-time maps, vehicle location lists, alerts, graphs, messages, landmark visits, and more.
Overview
The Portal welcomes you with the Explore Page upon sign-in. This page offers quick access to areas of interest such as reports, alerts, fleet administration, chat support, and more via clickable links. You can also access New Release information, tutorials, and quick links to other helpful resources.
Our original Portal, Advanced Admin (Classic), is still available and accessible from the Explore Page.
Navigation
From the Explore Page, use the Navigation Bar on the left-hand side of the screen to access other Portal pages, adjust your preferences, get help, or collapse/expand your Navigation Bar.
Available Portal pages include:
Advanced Admin - Available to Advanced Administration add-on and/or Enterprise customers. Navigate to the legacy Portal (Classic) to access advanced administrative functionalities such as hierarchies and account-level reporting.
Map - The Map transforms your workspace to an interactive map featuring two tabs, Current and History, with quick access to management of drivers, vehicles, assets, landmarks, dispatch, and POIs.
Media Library - Available for accounts with camera solutions, the Camera Media page is your central hub for managing camera clips. Here, you can filter, view, rename, download, and request additional clips. You can also see your clip quota and the date it resets.
Maintenance - View and manage scheduled and completed maintenance service tasks.
Dashboards - Available to Advanced Administration add-on and/or Enterprise customers.Navigate to the Dashboards section of the Advanced Admin Portal to view customizable dashlets that give you at-a-glance insight into the fleet information that matters most to you, with quick access to interact with vehicle data.
Alerts - Create and manage alerts for hierarchies, vehicles, and vehicle groups.
Reports - Run ad-hoc and/or schedule configurable reports with the data you need to see.
Admin - The Admin page is your central hub for managing account settings. From here, you can quickly view and manage users, vehicle groups, drivers and driver groups, landmark groups, and cameras (if applicable).
You may also use the Page tiles to access Dashboards, Map, Reports, and Alerts pages.
Setting User Preferences
Click Preferences from the Navigation Bar to set or adjust user preferences for the following:
Measurement Units - US (Standard) or Metric
Time Zone - US/Hawaii, US/Alaska, US/Pacific, US/Arizona, US/Mountain, US/Central, US/Eastern, Canada/Atlantic, America/Puerto Rico, UTC
Default Page (Page displayed upon user login) - Explore, Map, or Dashboard
Group/Hierarchy (Hierarchy available to Advanced Administration add-on and/or Enterprise customers) - Determines which dropdown list is shown in the field below for "Apply Default Group/Hierarchy."
Default Group/Hierarchy - Select the group or hierarchy (available to Advanced Administration add-on and/or Enterprise customers) to display by default, instead of the system default of "ALL VEHICLES."
Apply Default Group/Hierarchy to (Hierarchy available to Advanced Administration add-on and/or Enterprise customers) - Apply the selected default group/hierarchy to Map, Reports, and Alerts pages, to the Map page only, or to Reports and Alerts pages.
Side-bar Theme - Dark or Light
Need Help?
Click Help from the Navigation Bar to access links to our Help Center or chat/open a ticket with Support.
Help Center - Opens a new tab in your browser to our Help Center, a one-stop shop for Documentation, Troubleshooting, Installation Guides, and more.
Support - Opens a pop-up where you can chat with Support, view system status, check out our most recent blog post, and more.
[post_title] => About the Portal
[post_excerpt] =>
[post_status] => publish
[comment_status] => closed
[ping_status] => closed
[post_password] =>
[post_name] => about-the-new-portal
[to_ping] =>
[pinged] =>
[post_modified] => 2026-02-27 11:07:26
[post_modified_gmt] => 2026-02-27 18:07:26
[post_content_filtered] =>
[post_parent] => 0
[guid] => https://help.gpsinsight.com/?post_type=documentation&p=21265
[menu_order] => 0
[post_type] => documentation
[post_mime_type] =>
[comment_count] => 0
[filter] => raw
)
[3] => WP_Post Object
(
[ID] => 26188
[post_author] => 12
[post_date] => 2022-12-14 14:09:18
[post_date_gmt] => 2022-12-14 21:09:18
[post_content] => You can add a group (landmark and vehicle), landmark, asset, user, and vehicle directly from the Map page.
You can only add one group, landmark, asset, user, or vehicle at a time.
Adding a Group
How to add a group:
From the Map, click the + icon ().
A drop-down window appears.
Hover your mouse over or click Group, then click Landmark Group or Vehicle Group.
Depending on your selection, the New Landmark Group or New Vehicle Group card appears.
Enter a name for the new group under "Group Name."
Use the Search field to search for landmarks or vehicles to select or select landmarks or vehicles by scrolling through the list.
Click Save.
A pop-up message appears confirming that the new group was saved successfully.
Adding a Landmark
Note: You can also create and manage individual landmarks from the Admin: Landmark tab.
How to add a landmark:
Alerts are only generated for Landmarks with an area smaller than a 10,000-foot radius. Landmarks exceeding this size will be excluded from alert generation. Please review your Landmark sizes to ensure critical locations are within the alerting threshold.
From the Map, click the + icon ().
A drop-down window appears.
Click Landmark.
The Create Landmark card appears.
Select Circle or Polygon as the shape of your landmark.
Polygons allow you to define a more precise boundary by tracing an outline around a specific area (up to 256* vertices). Polygon landmarks are more often used when the exclusion or inclusion of specific perimeters is important, such as when sending alerts when a vehicle enters or exits a specific location.
In the Landmark Name text field, enter a name for the landmark.
Select a color for the landmark.
Optional: Click View suggested address to see the street address based upon the lat/lon coordinates of the landmark. You can choose to populate the address detail fields with the suggested address by clicking Confirm and fill. To exit out of viewing the suggested address, click Close.
Optional: Enter Address Details (Street, City, State, Country, Zip).
If you have selected Circle as your landmark shape, you will have the option to enter the radius of the circle in feet/meters (If lat/long coordinates are not entered then the default size is 750 feet or 228.5999926848002 meters).
Optional: Use the drop-down window to select a Landmark Group.
Click + Create landmark.
The Landmark is created and the corresponding Landmark Card appears.
Adding an Asset
To add an asset, the asset must be tracked with a GPS device. If you would like to equip your asset with a GPS device, please contact your Account Manager for assistance.
How to add an asset:
From the Map, click the + icon ().
A drop-down window appears.
Hover your mouse over or click Asset.
The Create New Asset pop-up appears.
Enter information for the asset in the available fields:
Asset Label (Required)
VIN or Serial Number (Required)
Year
Make
Model
Color
Icon (select option from drop-down)
Country (Required)
License State (select option from drop-down)
License Plate
Device: Device Serial Number (Required)
Mileage and Runtime: Odometer (Required) and Engine Hours
A pop-up message appears confirming that the new asset was saved successfully.
We recommending creating a Vehicle Group of your assets to simplify and organize any asset-specific reporting needs.
Adding a User
How to add a user:
From the Map, click the + icon ().
A drop-down window appears.
Click User.
The New User card appears.
In the Details section, complete the following fields:
Username
Email
First Name
Last Name
Phone (Optional)
Address (Optional)
State (Optional)
Zip (Optional)
Use the drop-down under Country to select a country.
Use the drop-down under Country to select a timezone.
In the Vehicle Groups section, use the drop-down to select a vehicle group.
Click Create.
The User is created and the corresponding User Card appears.
[whitelabel tier="limited,full"]
Adding a Vehicle
How to add a vehicle:
From the Map, click the + icon ().
A drop-down window appears.
Click Vehicle.
The New Vehicle card appears.
Under the Details section, complete the following fields:
Vehicle Label
Device Serial Number
Under the Vehicle Details section, complete the following fields:
VIN
The Portal uses decodethis.com as the VIN decoder.
Year (Optional)
Make (Optional)
Model (Optional)
Color (Optional)
Use the drop-down to select a country.
Use the drop-down to select a license state.
Enter in the vehicle's license plate.
Under the Mileage & Engine Hours section, enter in odometer (required) and runtime (optional).
Under Fuel Info section, use the drop-down to select fuel type and enter in fuel capacity, engine size (L).
The Idle GPH will populate automatically once the Fuel Capacity and Engine Size (L) fields are completed.
Under the Contact Info section, enter in phone, email and select an alert preference (Email or SMS).
Under the Vehicle Groups section, use the drop-down to select a vehicle group (if applicable).
Click Save.
[/whitelabel]
[whitelabel tier="gpsi"]
Adding a Vehicle
How to add a vehicle:
From the Map Page, click the + icon ().
The Create New drop-down window expands.
Click Vehicle.
The Create vehicle panel appears on the right-hand side of the screen.
Under the Required Details section, complete the following fields:
Vehicle Label
VIN
The Portal uses decodethis.com as the VIN decoder.
Device Serial Number
Under the Vehicle Information section, complete the following fields:
Year (Optional)
Make (Optional)
Model (Optional)
Vehicle Class: Light-Duty, Medium-Duty, Heavy Duty (Optional)
Vehicle class selection configures the device to more accurately reflect vehicle activity and behavior events. If not selected, Light-Duty is automatically applied as the vehicle class.
Color (Optional)
Under the Vehicle Registration Information section, complete the following fields:
Use the drop-down to select a country (Required).
Use the drop-down to select a license state.
Enter in the vehicle's license plate.
Under the Mileage, Engine Hours and Fuel Information section, complete the following fields:
Odometer (Required)
Engine Hours (Optional)
Engine Size (Optional)
Use the drop-down to select fuel type (Optional)
Fuel Capacity (Optional)
The Idle GPH will populate automatically once the Engine Size, Fuel Type, and Fuel Capacity fields are completed.
Under the Vehicle Groups Membership, select a group or groups (Optional).
Under the Hierarchy Memberships, select hierarchy trees and nodes for the vehicle (Optional).
Under the Contact Information section, enter in phone, email and select an alert preference (Email or SMS).
Click + Create vehicle.
OEM Selection
For customers with OEM-equipped vehicles, you can add your vehicles to the GPS Fleet Tracking Portal using the same process outlined above with a few differences.
The OEM integration is powered by CerebrumX.
Adding an OEM-Equipped Vehicle
Before adding a vehicle, you must be on the OEM Plan, or OEM EV Plan for electric vehicles. Plans are enabled through a contract and must be activated prior to being able to add vehicles in the Portal. Contact your Account Manager if you are interested in adding OEM-equipped vehicles to your account.
Sign the contract with your Account Manager for the number of OEM licenses you need.
For each OEM manufacturer you want to connect (for example, Ford, GM, etc.), we’ll initiate a consent request on your behalf through CerebrumX.
Once consent is initiated, we’ll add the corresponding OEM license slots (also called virtual devices) to your GPS Fleet Tracking account.
Follow the instructions outlined above to add the OEM-equipped vehicle; however, in Step #3, when using the drop-down to select the Device Serial Number, the available OEM devices have device serial numbers beginning with OEM and end with (OEM).
The following items are required to add OEM-equipped vehicles: Contract for the specific number of licenses required is signed, manufacturer consent is approved, and vehicle VIN is eligible for OEM data
Data should be available within 24 hours after manufacturer consent and eligibility is confirmed.
[/whitelabel]
[post_title] => Adding Groups, Landmark, Assets, Users, & Vehicles
[post_excerpt] =>
[post_status] => publish
[comment_status] => closed
[ping_status] => closed
[post_password] =>
[post_name] => adding-groups-landmark-users-vehicles
[to_ping] =>
[pinged] =>
[post_modified] => 2026-09-08 10:29:01
[post_modified_gmt] => 2026-09-08 17:29:01
[post_content_filtered] =>
[post_parent] => 21265
[guid] => https://help.gpsinsight.com/?post_type=documentation&p=26188
[menu_order] => 1
[post_type] => documentation
[post_mime_type] =>
[comment_count] => 0
[filter] => raw
)
[4] => WP_Post Object
(
[ID] => 27223
[post_author] => 12
[post_date] => 2023-05-10 11:58:38
[post_date_gmt] => 2023-05-10 18:58:38
[post_content] => Welcome to Fleet Tracking! An account has been created for you and it's time to log in to your Fleet Tracking Portal to check out your new software tool.
Welcome Email
After an account has been created for you, you will receive an email from Support with the subject line "Welcome! Let's get started." This email includes your username and temporary password, along with instructions on how to log in for the first time.
Logging in to the Portal
How to log in:
In a browser tab, navigate to [whitelabel_portal].
Bookmark this address, as this is where you'll sign in each time you use [whitelabel_name] Fleet Tracking.
The Login page appears.
Enter your username as listed in the Welcome Email and click Next.
Alternatively, you can click Send a Magic Link to get a magic link sent to your email that'll sign you in instantly (see instructions for Magic Link login below).
The password field appears.
Enter the temporary password supplied in the Welcome Email and click Login.
You are prompted to change your password.
Enter a new password in the New password field and confirm your new password by repeating it in the Repeat password field, then click Submit.
You are automatically redirected to the Portal and greeted with the Explore page. You are now logged in to the Portal.
Using Magic Link
On the Login page, you have the option to use Magic Link to sign in to the [whitelabel_name] Fleet Tracking Portal automatically after clicking a link sent to your email.
How to log in using Magic Link:
On the Login page, click Send a Magic Link.
The Passwordless login form appears.
In the Login ID text field, enter your username or email address to receive a login link via email.
Click Send.
An email with the subject line of "Log into [whitelabel_name] is sent to your email address containing your Magic Link.
This link will be valid for 5 minutes, and may only be used once.
Click Go To Portal link in the email.
A browser tab opens and a pop-up message asks if you'd like to stay signed in.
Click Yes to reduce the number of times you are asked to log in.
If the computer you are using is a shared device (e.g., a computer at a library), we recommend clicking No to keep your account as secure as possible.
You are automatically redirected to the Portal and greeted with the Explore page. You are now logged in to the Portal.
[post_title] => Logging In to the Portal
[post_excerpt] =>
[post_status] => publish
[comment_status] => closed
[ping_status] => closed
[post_password] =>
[post_name] => logging-in-to-the-portal
[to_ping] =>
[pinged] =>
[post_modified] => 2026-06-28 23:28:47
[post_modified_gmt] => 2026-06-29 06:28:47
[post_content_filtered] =>
[post_parent] => 0
[guid] => https://help.gpsinsight.com/?post_type=documentation&p=27223
[menu_order] => 0
[post_type] => documentation
[post_mime_type] =>
[comment_count] => 0
[filter] => raw
)
[5] => WP_Post Object
(
[ID] => 26365
[post_author] => 12
[post_date] => 2023-01-06 10:37:21
[post_date_gmt] => 2023-01-06 17:37:21
[post_content] => You can edit and/or delete a group (landmark and vehicle), landmark, user, asset (edit only) and vehicle (edit only) directly from the Map page.
You can only edit one group, landmark, user, asset or vehicle at a time.
Editing a Group, Landmark, User, Asset, or Vehicle
Note: For a centralized table view to edit or delete individual landmarks, see the Admin: Landmark tab.
How to edit:
To edit, simply locate the group, landmark, user, asset, or vehicle that you would like to edit using the Search bar at the top of the map or the Map List/Map List filter.
Alerts are only generated for Landmarks with an area smaller than a 10,000-foot radius. Landmarks exceeding this size will be excluded from alert generation. Please review your Landmark sizes to ensure critical locations are within the alerting threshold.
The corresponding Card (Landmark/Vehicle Group Card, Landmark, User, Asset or Vehicle) will display.
Click Edit.
Enter your edits and click Save.
Edits to the corresponding Card are saved.
Changing an Entity Type
You can change the entity type for a vehicle to an asset or vice-versa.
How to change an entity type:
To edit, simply locate the asset or vehicle that you would like to change using the Search bar at the top of the map or the Map List/Map List filter.
The corresponding Card (Asset or Vehicle) will display.
Click Edit.
Scroll to the Change entity type (optional) section, select the desired entity type (Asset or Vehicle).
Click Save.
The entity type is changed and the entity will display under the applicable Map List.
Deleting a Group or Landmark
Vehicles and assets cannot be deleted; however, users with Vehicle Admin permissions can submit a request to deactivate the device. Deactivations are processed at the end of the month, after which the device is removed from registered devices and is no longer visible on the Map page.
How to Delete:
To delete, simply locate the group or landmark that you would like to delete using the Search bar at the top of the map or the Map List/Map List filter.
The corresponding Card (Landmark/Vehicle Group Card or Landmark) will display.
Click Delete.
A pop-up appears asking you to confirm you would like to make the deletion.
Click Yes, Delete to delete the entry or No, Cancel to exit without making a change.
The Camera Media page provides a centralized location for managing camera clips. From this page, you can filter, view, rename, download, and request additional media clips. You can also view your clip quota and see when it will reset.
Viewing Camera Event Clips
Camera media appears in a list on the left side of the Camera Media page. You can use filters to narrow the results and quickly locate the footage you need.
Varies by camera/plan, but may include: Distracted Driver Initiated Drowsiness Follow Distance Positive Driving Hard Acceleration Hard Brake Hard Turn Phone Usage Potential Incident Seatbelt Speeding Violation Camera Obstruction Stop Sign Violation
Timeframe
Today (default) Yesterday Last 7 days Last 30 days This month Custom Range
Note: The Hierarchy feature is available only to Enterprise or Advanced Administration add-oncustomers. If you’re interested in learning more, please contact your Account Manager.
To clear Event Type filters, simply click the X to clear all selected filters, or you may click the Event Type drop-down to uncheck the box for specific filters. Additionally, an Undo button is available to reverse the most recent selection of the Event Type filter.
You may use the drop-downs for Entity Type, entity, and timeframe to adjust your selections.
How to View Camera Clips
You can view camera clips from the Camera Media page.
From the Camera Media page, locate the clip you would like to view by using the filters and/or scrolling through the list of camera clips.
(Skip this step if you have FAIO Pro Plus) Click Request Clip next to the camera event you would like to request.
A request is sent to the camera to transmit the video. Once the video is available, the icon is updated to a Play icon.
Click the Play icon for the clip you would like to view.
A pop-up window opens, and the event playback automatically starts.
Click the Full Screen icon to view the video in Full View. The following actions are also available:
Unmute: Unmute the video (muted by default) to hear audio.
Playback Rate: Change the playback speed (1x, available).
Pause: Stop the video during playback.
Note: Within Full View mode (not Split View), you can click and drag in the video to see different angles.
Managing Camera Clips
You can rename and/or download clips from the Camera Media page. Additionally, you can request more media from a clip to initiate a Manual Clip Request.
From the Camera Media page, locate the camera clip you would like to manage by using the filters and/or scrolling through the list of camera clips.
From the Clip entry, click the Overflow button to access additional options:
Rename
Enter a new name for the clip and click Save.
Download
Click the Overflow button from the Fullscreen video playback, then click Download.
You can also Download the clip from the playback pop-up by clicking the Download icon.
Request More Media
Complete the available fields in the Request Media pop-up, then click Request Media.
Requesting Media Manually
You can request camera footage from a vehicle for a specific date/time that is not connected with an auto-generated camera event. This access is helpful if you are looking into customer complaints or need to check on activity before or after a camera event.
How to Request Media Manually:
From the Camera Media page, click Request media from the left-hand List panel.
The Request media pop-up appears. In the bottom-left corner, the pop-up displays your current clip quota, allowing you to quickly see your available clips.
Note: Requested manual clips count toward your account quota.
Use the drop-down under “Vehicle” to select the applicable vehicle.
(Optional) Enter a name for the clip under “Clip Name.”
Under “Start Date”, select a date using the calendar picker.
Under “Start Time”, use the time picker to select a time or click Now.
Use the Duration drop-down to select the clip duration (30 seconds or 1 minute).
Note: A 30-second clip counts as 1 clip toward your quota; whereas a 1-minute clip counts as 2 clips toward your quota.
Click Request Media.
A message is shown toward the top-right of the screen to confirm the clip was requested successfully.
After a clip request is submitted, it may take some time for the video to appear in the list of clips while the Portal updates and the camera responds. Manually requested media clips are delineated from auto-generated camera events in the Media Results list with a “Manual” designation.
Note: Requested clips remain available in the GPS Fleet Tracking Portal for 90 days from the original requestdate. Media is stored based on available capacity, and older files may be overwritten when the SD card becomes full.
Viewing Event Clip Quotas
The Camera Media page offers an at-a-glance display of your event clip quotas. If you have a combination of Driveri and Drive360/AIR II, quotas between these two types are shown separately.
To see when your quota resets, hover your mouse over the quota. A pop-over will appear showing the number of days until the next reset.
[post_title] => Using the Camera Media Page
[post_excerpt] =>
[post_status] => publish
[comment_status] => closed
[ping_status] => closed
[post_password] =>
[post_name] => using-the-camera-media-page
[to_ping] =>
[pinged] =>
[post_modified] => 2026-03-24 09:26:48
[post_modified_gmt] => 2026-03-24 16:26:48
[post_content_filtered] =>
[post_parent] => 31953
[guid] => https://help.gpsinsight.com/?post_type=documentation&p=31979
[menu_order] => 0
[post_type] => documentation
[post_mime_type] =>
[comment_count] => 0
[filter] => raw
)
)
[post_count] => 7
[current_post] => -1
[before_loop] => 1
[in_the_loop] =>
[post] => WP_Post Object
(
[ID] => 25065
[post_author] => 12
[post_date] => 2023-03-21 07:44:24
[post_date_gmt] => 2023-03-21 14:44:24
[post_content] => You can use the App Switcher from the top bar of the Fleet Tracking Portal to easily access your Field Service Management or Driveri applications.
If you do not have either the Field Service Management and/or Driveri solutions added to your account and you click on either option from the App Switcher, you are redirected to a landing page to learn more about the applicable solution add-on.
Using the App Switcher
How to use the App Switcher:
From the Portal, click the App Switcher button ().
A drop-down menu appears.
Click the application you would like to use.
The selected application opens.
We offer Single Sign On (SSO) for customers with the Driveri platform who would like users to be automatically signed in to the platform upon clicking the Driveri option from the App Switcher. To enable SSO for your account, please contact your Account Manager.
Question:
I noticed that the history trail of one of my vehicles follows the road with great accuracy until it enters a heavy tree covered area, at which point it begins to slightly deviate from the road. Although I can see that the route generally follows the shape of the road, it does so with much less precision. Why does this happen?
How GPS Units Track Data
A GPS unit receives data from GPS satellites that orbit 12,000 miles above the earth. There are 24+ GPS satellites orbiting the earth at any one time. GPS satellites send satellite location, time, and satellite health information using standard radio frequencies. The GPS unit picks up these radio frequencies, and calculates its location based on triangulation between at least three satellites. This calculation is heavily dependent on time information sent by the satellite, as the time between transmission and receiving of the signal is what is used to determine the distance of the satellite. The GPS unit communicates telematics data to GPS Insight using the cellular network based on the reporting interval for which it is programed.
Accuracy of GPS Technology
After the GPS unit receives information from all satellites within range, the unit calculates the latitude and longitude of the GPS unit. The GPS unit is normally accurate to within two meters Circular Error Probability (CEP), and the accuracy is further increased through algorithms built into [whitelabel_name]. Analysis of the GPS information provided by [whitelabel_name] yields an accuracy rate of approximately 99.88%. In most cases, inconsistencies and erroneous data elements come from a single incorrect reading; as the sample set of data is increased, the more the more accurate and reliable the data becomes (see GPS drift). While not every erroneous piece of data is caught, there are many filters in place to find and eliminate erroneous readings.
Limitations of GPS Technology
Due to all of the independent technologies used to produce GPS data, there are some limitations to GPS technology, which are typically categorized as GPS Drift and Signal Bounce. These limitations are due to factors such as:
Satellite positioning
Satellite health status
Radio frequency interference
Natural and man-made obstructions
Atmospheric interference
GPS Drift
GPS drift refers to the magnitude of inaccuracy of a device's positional data (e.g., the number of meters within CEP). Drift may occur when GPS satellite constellation patterns change, the device enters an area with poor reception, or other conditions that are out of our control. Erroneous data points that are occasionally created by GPS drift are primarily noticeable within calculations that are affected by single points of data, such as [glossary slug="inst-speed"]instant speed[/glossary] data and [glossary slug="g-force"]g-force[/glossary] calculations. Therefore, this type of data is best used at a summary level.
Signal Bounce
GPS satellites send signals to our units using radio frequencies, which are occasionally subject to interference and signal bounce off of large objects (e.g., buildings, overpasses, and mountains/natural obstructions). When our unit is close to these objects, there is a chance that the signal from the satellite will bounce off of these objects, and cause our unit to incorrectly calculate the timing of the signal, which will affect the unit's calculation for its location. When this issue does occur, the erroneous data is usually more pronounced than what you would find with GPS drift, and you can typically isolate the cause when reviewing vehicle history (i.e, the vehicle was driving under large overpasses on freeways or traveling through large metropolitan areas surrounded by high rise buildings).
Other Considerations
[whitelabel_name] receives posted speed limit data from third-party vendors. The quality of this information is determined by the municipalities that provide the information to the third-party vendors. Major metropolitan areas have a very high degree of accuracy in regard to posted limits, while rural areas tend to have no posted speed limit data, or outdated data. Additional considerations that impact posted speed limit data include:
Recent changes in posted speed limits that are not yet reflected in our data
Construction zones / temporary speed limits
GPS drift on highways that may be reporting the location of the vehicle on a parallel road or service road
[whitelabel_name] provides you with the ability to report incorrect speed limits within the speed violations report. [whitelabel_name] recommends that users thoroughly research and validate all speed-violation incidents prior to taking any action on a reported speed-violation. Read more about speed definitions.
[post_title] => How accurate is GPS technology?
[post_excerpt] => A GPS unit receives data from GPS satellites that orbit 12,000 miles above the earth.
[post_status] => publish
[comment_status] => closed
[ping_status] => closed
[post_password] =>
[post_name] => how-accurate-is-gps-technology
[to_ping] =>
[pinged] =>
[post_modified] => 2024-07-26 07:47:28
[post_modified_gmt] => 2024-07-26 14:47:28
[post_content_filtered] =>
[post_parent] => 0
[guid] => http://gpsihelp.wpengine.com/?post_type=deepdive&p=878
[menu_order] => 0
[post_type] => deepdive
[post_mime_type] =>
[comment_count] => 0
[filter] => raw
)
[1] => WP_Post Object
(
[ID] => 1463
[post_author] => 12
[post_date] => 2016-02-12 20:12:57
[post_date_gmt] => 2016-02-13 03:12:57
[post_content] =>
Question:
I noticed three different speed values on my report (Max, Avg, and Inst). How are each of those calculated, and why doesn't the system use the vehicle speed from my engine's computer if diagnostics are supported?
Speed Definitions
[whitelabel_name] calculates speed using point to point GPS measurement, which is done by analyzing the straight-line distance traversed by the vehicle between two geographic points and dividing this by the time traveled to get the mph of the vehicle:
Average speed. The average speed during a device’s report interval, which is obtained at the device level and then verified by calculating the distance traveled (beginning and ending odometer values) and time (update period).
Instantaneous speed. The last speed value sampled during a device’s report interval. For example, if a device’s report interval is 2 minutes, the Instantaneous speed is the last data point obtained of the 480 data points collected during the update period (4 times per second x 2 minutes).
Maximum speed. The highest speed value sampled during a device’s report interval. For example, if a device’s report interval is 2 minutes, the Max Speed is the highest data point of the 480 data points collected during the update period (4 times per second x 2 minutes).
Speed in Alerts
Any alert* that supports a speed threshold will default to using the Inst speed value. None of our alerts use the "Vehicle Speed" as reported from diagnostics (if your device supports it). That diagnostic output varies by make/model/year and sometimes isn't reported at all. Using point to point GPS calculations ensures a consistent benchmark against which to measure all vehicles.
[solution term="pro,enterprise"]
The Speeding Alert is the only alert that includes the option to change the default Inst speed to Avg speed. This option is valuable when you need to deduce that a violation occurred at a fixed time and location (e.g., speeding inside the boundaries of a relatively small landmark). The Avg speed option is valuable when you already know a vehicle will have been inside a landmark (e.g., speeding inside the boundaries a vehicle yard in which the vehicle never leaves or speeding inside a relatively large landmark, such as county lines).
[/solution]
Speed on Reports
If the device supports a diagnostic installation, Vehicle Speed may be reported directly from the vehicle's diagnostic port. (Engine speed may also be included, but it is important to note that this variable is measured in RPMs instead of MPH.) If reported, you can add those values to applicable reports--such as the Activity Detail Report. The variance between Vehicle Speed from diagnostics and speed values calculated by the GPS system depends on your reporting interval or other factors. Speed provided from diagnostics is always the instantaneous speed (max not available).
The following example shows an actual report from an employee who was served with a photo radar ticket for traveling 51 mph in a 40 mph zone. The vehicle's reporting interval is 2 minutes. In this case, the Inst speed matched the photo radar value exactly (51 mph); the Vehicle Speed (from diagnostics) was also reliable (50.94).
Although this driving instance might be considered aggressive, it is hardly egregious. Whenever possible, shape your driver policies on summary data rather than calculations that are affected by single points of data, such as instant speed and g-force. For example, the Speed Summary Report can mitigate these potential inaccuracies by reviewing the data over a significant period of time, which will better identify drivers that continually trend higher with respect to speed rather than isolated instances.
Posted Speed
If a posted speed limit is not correct in the report, you can report an incorrect speed through the portal.
The Posted Speed Violations Report is based on currently available speed limit information from HERE.COM (formerly NAVTEQ). This data does not include temporary speed reductions such as construction or school zones. Many speed limits are 5-10 MPH different in either direction in actuality, and the data is not guaranteed. In some cases, an "average" (such as 42 MPH) between two speeds (40 & 45) is used, which certainly differs from the actual speed limit. As much information as is available is provided for a management individual to reach a reasonable conclusion when it comes to speeding offenses. We strongly encourage you to weigh all the facts before discussing speeding violations with drivers or acting upon this data. [whitelabel_name] offers the Posted Speed Report free of charge, but with no guarantees that the information provided is 100% accurate, or that the report will continue to be made available free of charge or at all, due to licensing restrictions. By using the Posted Speed Violations Report you acknowledge that the data may not be 100% accurate, and that reasonable interpretation is required to make use of this report. You also acknowledge that [whitelabel_name] will not be held liable for any misinterpretation of or inaccurate data within the Posted Speed Violations Report, and that this report may be removed from the suite of reports at any time and with no guarantees.
Sustained Speeding
Sustained speeding occurs when two or more consecutive instantaneous speed points are above the speeding threshold within a given time period (customizable). For example, if your device reports every two minutes, a sustained speed instance would occur whenever two instantaneous speed values in a row are above the speeding threshold. Because instantaneous speed values are the last data point received on an update (typically every two minutes), a sustained speed could be determined after four or more minutes of driving time.
Depending on the device type (e.g., GO9™), sustained speed can be determined in as little as 30 seconds as speed data is collected in seconds.
Let's look at actual examples for a vehicle with a two-minute reporting interval:
[row]
[column lg="4" md="12" sm="12" xs="12" ]
This vehicle had 31 individual posted speed violations.
Sustained speeding (duration) is not considered.
[/column]
[column lg="4" md="12" sm="12" xs="12" ]
During the same time period, this vehicle only had two sustained posted speed violations for a threshold of two minutes.
The minimum driving time required to collect two consecutive inst speed values is four minutes.
[/column]
[column lg="4" md="12" sm="12" xs="12" ]
During the same time period, this vehicle only had one sustained posted speed violation for a threshold of four minutes.
The minimum driving time required to collect four consecutive inst speed values is eight minutes.
[/column]
[/row]
[post_title] => How does my device report speed?
[post_excerpt] => I noticed three different speed values on my report (Max, Avg, and Inst). How are each of those calculated, and why doesn't the system use the vehicle speed from my engine's computer if diagnostics are supported?
[post_status] => publish
[comment_status] => closed
[ping_status] => closed
[post_password] =>
[post_name] => how-does-my-device-report-speed
[to_ping] =>
[pinged] =>
[post_modified] => 2023-04-11 12:31:16
[post_modified_gmt] => 2023-04-11 19:31:16
[post_content_filtered] =>
[post_parent] => 0
[guid] => http://gpsihelp.wpengine.com/?post_type=deepdive&p=1463
[menu_order] => 0
[post_type] => deepdive
[post_mime_type] =>
[comment_count] => 0
[filter] => raw
)
)
[post_count] => 2
[current_post] => -1
[before_loop] => 1
[in_the_loop] =>
[post] => WP_Post Object
(
[ID] => 878
[post_author] => 12
[post_date] => 2016-01-11 18:39:25
[post_date_gmt] => 2016-01-12 01:39:25
[post_content] =>
Question:
I noticed that the history trail of one of my vehicles follows the road with great accuracy until it enters a heavy tree covered area, at which point it begins to slightly deviate from the road. Although I can see that the route generally follows the shape of the road, it does so with much less precision. Why does this happen?
How GPS Units Track Data
A GPS unit receives data from GPS satellites that orbit 12,000 miles above the earth. There are 24+ GPS satellites orbiting the earth at any one time. GPS satellites send satellite location, time, and satellite health information using standard radio frequencies. The GPS unit picks up these radio frequencies, and calculates its location based on triangulation between at least three satellites. This calculation is heavily dependent on time information sent by the satellite, as the time between transmission and receiving of the signal is what is used to determine the distance of the satellite. The GPS unit communicates telematics data to GPS Insight using the cellular network based on the reporting interval for which it is programed.
Accuracy of GPS Technology
After the GPS unit receives information from all satellites within range, the unit calculates the latitude and longitude of the GPS unit. The GPS unit is normally accurate to within two meters Circular Error Probability (CEP), and the accuracy is further increased through algorithms built into [whitelabel_name]. Analysis of the GPS information provided by [whitelabel_name] yields an accuracy rate of approximately 99.88%. In most cases, inconsistencies and erroneous data elements come from a single incorrect reading; as the sample set of data is increased, the more the more accurate and reliable the data becomes (see GPS drift). While not every erroneous piece of data is caught, there are many filters in place to find and eliminate erroneous readings.
Limitations of GPS Technology
Due to all of the independent technologies used to produce GPS data, there are some limitations to GPS technology, which are typically categorized as GPS Drift and Signal Bounce. These limitations are due to factors such as:
Satellite positioning
Satellite health status
Radio frequency interference
Natural and man-made obstructions
Atmospheric interference
GPS Drift
GPS drift refers to the magnitude of inaccuracy of a device's positional data (e.g., the number of meters within CEP). Drift may occur when GPS satellite constellation patterns change, the device enters an area with poor reception, or other conditions that are out of our control. Erroneous data points that are occasionally created by GPS drift are primarily noticeable within calculations that are affected by single points of data, such as [glossary slug="inst-speed"]instant speed[/glossary] data and [glossary slug="g-force"]g-force[/glossary] calculations. Therefore, this type of data is best used at a summary level.
Signal Bounce
GPS satellites send signals to our units using radio frequencies, which are occasionally subject to interference and signal bounce off of large objects (e.g., buildings, overpasses, and mountains/natural obstructions). When our unit is close to these objects, there is a chance that the signal from the satellite will bounce off of these objects, and cause our unit to incorrectly calculate the timing of the signal, which will affect the unit's calculation for its location. When this issue does occur, the erroneous data is usually more pronounced than what you would find with GPS drift, and you can typically isolate the cause when reviewing vehicle history (i.e, the vehicle was driving under large overpasses on freeways or traveling through large metropolitan areas surrounded by high rise buildings).
Other Considerations
[whitelabel_name] receives posted speed limit data from third-party vendors. The quality of this information is determined by the municipalities that provide the information to the third-party vendors. Major metropolitan areas have a very high degree of accuracy in regard to posted limits, while rural areas tend to have no posted speed limit data, or outdated data. Additional considerations that impact posted speed limit data include:
Recent changes in posted speed limits that are not yet reflected in our data
Construction zones / temporary speed limits
GPS drift on highways that may be reporting the location of the vehicle on a parallel road or service road
The What's New? section of the homepage is your direct connection to recent updates to the product! This section links to Release Notes providing new features and updates within the Portal. Click on the link to view Release Notes on the Help Center.
Task Bar
The task bar of the homepage is your direct connection to our updated Portal! This section provides links and descriptions of new features and options within the new Portal. Click on each Feature Tile to navigate directly to that section of the new Portal.
Administration
The Administration section of the homepage provides links to management features and options within the classic Portal. Until the new portal is fully integrated, you will have access to the classic portal to handle all of your fleet needs! Click on each Feature Tile to navigate directly to that section of the Classic Portal.
Popular Links
The Popular Links section provides links to different product resources you can access at any time.
Tutorials
The Tutorials section provides links to product training videos, courses, and tutorials.
Installing your GPS device is as easy as plugging in. The PNP-2000 is a non-diagnostic tracking device intended for light-duty vehicles ('95 or newer) with an OBD-II port.
Use the following link to learn how to install your device:
Navigate to the Portal and log in with your provided credentials. After you have successfully logged in, what you see is your default screen. This is the Map, it allows you to see the location of each of your vehicles on the left side of the screen and your controls are positioned on the right side of the screen.
Use the following link to learn how to use the Map:
[notification type="alert-warning" close="false" ]Mastering the Map[/notification]
Exploring Map Features
Next, you will want to explore scheduling reports, configuring alerts, and managing vehicles.
Use the following links to learn how to master the Map with helpful resources:
[notification type="alert-warning" close="false" ]Using Your Resources[/notification]
Continuing Your Education
Many self-service resources are also available on the GPS Insight Help Center such as product documentation, online help, video tutorials, product updates, Best Practices, Deep Dives, knowledgebase articles, and more.
We recommend you check out the following links to increase your knowledge:
Head over to the Portal to login with your credentials. The Portal requires Internet connection (DSL, broadband, or network connection recommended).
Meeting the Portal
Once you have logged in with your credentials, the Homepage from the new Portal is displayed by default.
Use the following link to learn how to use the Homepage and Map in the new Portal:
[notification type="alert-warning" close="false" ]Mastering the Portal[/notification]
Exploring Portal Features
Next, you will want to explore creating landmarks (also known as geofences), adding attributes, scheduling reports, configuring alerts, and using integrations from the Portal.
Use the following links to learn how to master the Portal with helpful articles, videos, and courses:
[notification type="alert-warning" close="false" ]Using Your Resources[/notification]
Continuing Your Education
Many self-service resources are also available on the GPS Insight Help Center such as product documentation, online help, video tutorials, sample reports, blog updates, frequently asked questions, quarterly webinars on new features, installation guides, knowledgebase articles, newsletters, and more.
We recommend you check out the following links to increase your knowledge:
* You will be required to log in with valid credentials to view these articles.
[/solution]
[post_title] => Getting Started
[post_excerpt] => If you need help getting started with the solution, please use this article as a starting point.
[post_status] => publish
[comment_status] => closed
[ping_status] => closed
[post_password] =>
[post_name] => getting-started
[to_ping] =>
[pinged] =>
[post_modified] => 2023-01-09 12:20:20
[post_modified_gmt] => 2023-01-09 19:20:20
[post_content_filtered] =>
[post_parent] => 0
[guid] => https://help.gpsinsight.com/?post_type=documentation&p=14571
[menu_order] => 0
[post_type] => documentation
[post_mime_type] =>
[comment_count] => 0
[filter] => raw
)
[2] => WP_Post Object
(
[ID] => 16691
[post_author] => 12
[post_date] => 2019-06-26 17:33:50
[post_date_gmt] => 2019-06-27 00:33:50
[post_content] =>
[notification type="alert-warning" close="false" ]Meeting the Portal - New & Classic[/notification]
Once you have logged in with your credentials, the new Portal is displayed by default.
New Portal
We have a fresh, new Portal Homepage and Map for you with a new UI aimed to improve your fleet tracking experience.
Using the Portal Navigation
Use the Navigation menu on the left-hand side of the screen to navigate to the following areas in the portal: Homepage, the Map, User Preferences page or to the Help Center.
[row]
[column lg="5" md="5" sm="5" xs="5" ]
[/column]
[column lg="4" md="4" sm="4" xs="4" ]
Classic (Portal)
Home (Homepage)
Map
Dashboards
Alerts
Reports
Preferences
Help (Help Center)
[/column]
[/row]
How to navigate:
Click Home to display the Homepage, click Map to display the Map, or click User Preferences to display the User Preferences page.
How to expand or collapse the Navigation menu:
You may also expand or collapse the Navigation menu by clicking the Expand or Collapse button respectively.
How to navigate the Map:
Map Features
The Map has the following features:
[et class="table-zebra" colwidth="15%|25%|60%"]
Number, Feature, Description
1,Map,Click on a vehicle or landmark on the Map to open the associated information card (appears on the right-hand side of the screen).~~~~
If any vehicles are unavailable due to unreliable data\, an Unavailable button is displayed on the Map (to the left of the Map Panel). See Unavailable List below for additional information.
1a,Map Panel,Use the Expand/Collapse button (on the right side of the Search Field) to expand or collapse the Map Controls Panel. The Map Control Panel includes the Search Field\, Map Controls/View\, and Vehicle/Landmarks List.
2,Search Field,Type a search term in the box (vehicle ID\, driver name\, landmark\, address/Point of Interest) to center the map over your query.
3,Map Controls/View,Perform basic map tasks such as dropping a pin\, sending a dispatch\, and more and set your map view preferences (e.g.\, show/hide Points of Interest\, landmarks\, traffic\, etc.).
4,Vehicles/Landmarks List,View your vehicles\, hierarchies\, vehicles groups (as selected in the Data Source Selector)\, or Landmarks.
[/et]
How to use the User Preferences page:
The link to open the User Preferences page and the User Preferences page itself are only available to users with User Admin permission.
The User Preferences page allows you to set your Dashboard preferences for measurement unit (US (Standard) or Metric), time zone, default account landing page (Homepage, Map (New!), Map (Classic) or Classic Dashboard), and side-bar theme (dark or light). Additionally, you can logout from this page.
Any preferences set in the User Preferences page will override preferences set in the Classic User Preferences tab.
How to get to the Help Center:
Click Help Center to open a new browser tab displaying the Help Center.
We are also providing access to our Classic Portal. Please see "Classic Portal" for more information.
[notification type="alert-warning" close="false" ]Using Your Resources[/notification]
Use the following links to learn how to use the new Homepage and Map with helpful articles and videos:
[notification type="alert-warning" close="false" ]Returning to Classic[/notification]
Classic Portal
If you would prefer to use the Classic Portal, you still can!
How to get back to Classic:
Simply click Back to Classic from the Navigation on the left-hand side of the screen to display the Classic Portal.
See Getting Started for tips for beginners using the Classic Portal.
[post_title] => New Homepage and Map
[post_excerpt] =>
[post_status] => publish
[comment_status] => closed
[ping_status] => closed
[post_password] =>
[post_name] => new-homepage-and-map
[to_ping] =>
[pinged] =>
[post_modified] => 2020-10-21 13:05:45
[post_modified_gmt] => 2020-10-21 20:05:45
[post_content_filtered] =>
[post_parent] => 14571
[guid] => https://help.gpsinsight.com/?post_type=documentation&p=16691
[menu_order] => 1
[post_type] => documentation
[post_mime_type] =>
[comment_count] => 0
[filter] => raw
)
)
[post_count] => 3
[current_post] => -1
[before_loop] => 1
[in_the_loop] =>
[post] => WP_Post Object
(
[ID] => 16356
[post_author] => 12
[post_date] => 2019-06-27 09:11:07
[post_date_gmt] => 2019-06-27 16:11:07
[post_content] => Welcome home! The Homepage is the first page you’ll see when you log into the Portal. This page will deliver critical information, including product updates and quick links to product features, and tutorials!
Features
What's New?
The What's New? section of the homepage is your direct connection to recent updates to the product! This section links to Release Notes providing new features and updates within the Portal. Click on the link to view Release Notes on the Help Center.
Task Bar
The task bar of the homepage is your direct connection to our updated Portal! This section provides links and descriptions of new features and options within the new Portal. Click on each Feature Tile to navigate directly to that section of the new Portal.
Administration
The Administration section of the homepage provides links to management features and options within the classic Portal. Until the new portal is fully integrated, you will have access to the classic portal to handle all of your fleet needs! Click on each Feature Tile to navigate directly to that section of the Classic Portal.
Popular Links
The Popular Links section provides links to different product resources you can access at any time.
Tutorials
The Tutorials section provides links to product training videos, courses, and tutorials.
How can you implement something similar in your business? Start with these videos (or documentation) to learn how to use the specific features shown in the use case video:
How can you implement something similar in your business? Start with these videos (or documentation) to learn how to use the specific features shown in the use case video:
How can you implement something similar in your business? Start with these videos (or documentation) to learn how to use the specific features shown in the use case video:
How can you implement something similar in your business? Start with these videos (or documentation) to learn how to use the specific features shown in the use case video:
[post_title] => Using Features to Create Solutions
[post_excerpt] => Features don’t create value, solutions do! Each feature in the portal is tied to a solution, and making that connection is the difference between an average deployment and a great one.
[post_status] => publish
[comment_status] => closed
[ping_status] => closed
[post_password] =>
[post_name] => using-features-to-create-solutions
[to_ping] =>
[pinged] =>
[post_modified] => 2019-08-23 09:54:07
[post_modified_gmt] => 2019-08-23 16:54:07
[post_content_filtered] =>
[post_parent] => 0
[guid] => http://help.gpsinsight.com/?post_type=bestpractice&p=2882
[menu_order] => 0
[post_type] => bestpractice
[post_mime_type] =>
[comment_count] => 0
[filter] => raw
)
)
[post_count] => 1
[current_post] => -1
[before_loop] => 1
[in_the_loop] =>
[post] => WP_Post Object
(
[ID] => 2882
[post_author] => 12
[post_date] => 2016-07-05 20:32:15
[post_date_gmt] => 2016-07-05 20:32:15
[post_content] => Features don’t create value, solutions do! Each feature in the portal is tied to a solution, and making that connection is the difference between an average deployment and a great one.
Most fleet management tracking goals fall into one or more of these categories: Increase Productivity, Increase Efficiency, Exceed Customer Expectations, and Build Community Value. Use these case videos to see examples of solutions to real-world challenges that you can apply to your own business to reduce costs, reduce risk, and increase revenue.
How can you implement something similar in your business? Start with these videos (or documentation) to learn how to use the specific features shown in the use case video:
How can you implement something similar in your business? Start with these videos (or documentation) to learn how to use the specific features shown in the use case video:
How can you implement something similar in your business? Start with these videos (or documentation) to learn how to use the specific features shown in the use case video:
How can you implement something similar in your business? Start with these videos (or documentation) to learn how to use the specific features shown in the use case video:
Question:
We just completed implementation, and things are running along smoothly. What advice do you have for issue prevention and detection? I don't want to run a report a year from now and discover too late that one of my devices stopped reporting six months earlier.
Yes! You already have a proactive mindset, so the rest of the process is easy. Once you identify whom should be notified of device health and device maintenance issues, the portal can help you do the rest. Here are some recommended approaches that new customers can use for issue prevention and detection.
Low Battery Detection
A switch alert for battery voltage will trigger when voltage on the red wire (constant power) drops below 11.8V for more than 30 minutes. In that case, the vehicle should be started as soon as possible to avoid dead vehicle battery. If an alert is triggered for a vehicle that has only been sitting for a short period of time, there is a good indication the battery in the vehicle is weak, or something else in the vehicle is drawing an excessive amount of power when the vehicles is off.
To set up a Switch Alert for Battery Voltage:
From the Account menu, click Manage Alerts, and then click Open.
On the Alerts page, click New Switch Alert (green plus sign )
In the New Alert window, choose the vehicle or group you want to monitor.
Modify the Alert Subject to "Battery Low."
Enter the email address(es) and SMS number(s) of the person(s) who should receive the alert.
Choose whether or not to notifiy the driver with a custom message when the alert is triggered.
If available, chose whether or not to have the in-cab notification and the notification type trigger.
In the Switch Type area, choose the option for Battery Voltage.
Set your parameters for Weekdays and Weekends.
Set landmark preference parameter.
If you would like the alert to send notification once then deactivate, check the box next to this option. We recommend not selecting this option for this type of alert.
Leave the defaults set for Repeat Delay, Per-Vehicle Delay, and Active settings.
Click Create New Alert.
You can also investigate low battery issues per vehicle in the Activity Detail Report using the Voltage column. For example, you may notice that a vehicle continues to trigger the battery voltage. The report can show whether that vehicle is frequently left parked for extended periods of time.
If your device includes a backup battery, the switch alert for external power lost will trigger when the tracking device goes from receiving power via the red wire (constant power) to receiving power via the internal device battery. This event may occur when a vehicle has a dead battery or when a device has been removed (possible tampering).
To set up a Switch Alert for External Power Lost:
From the Account menu, click Manage Alerts, and then click Open.
On the Alerts page, click New Switch Alert (green plus sign )
In the New Alert window, choose the vehicle or group you want to monitor.
Modify the Alert Subject to "External Power Lost."
Enter the email address(es) and SMS number(s) of the person(s) who should receive the alert.
Choose whether or not to notifiy the driver with a custom message when the alert is triggered.
In the Switch Type area, choose the option for External Power Lost.
Set your parameters for Weekdays and Weekends.
Set landmark preference parameter.
If you would like the alert to send notification once then deactivate, check the box next to this option. We recommend not selecting this option for this type of alert.
Leave the defaults set for Repeat Delay, Per-Vehicle Delay, and Active settings.
Click Create New Alert.
Performance Check
The Performance Report shows how long vehicles have been stopped the last time the device reported. To proactively monitor devices, schedule this report daily or weekly and sort by “Days Stopped” and “Last Reported” to quickly identify vehicles that need attention.
To schedule a Performance Report:
From the Account menu, click Manage Reports, and click Open.
The Scheduled Reports page opens in a new browser tab.
From the Report List grid, click New Scheduled Report (green plus sign ) next to the Performance Report.
You can also invoke a new scheduled report from within an existing report window ("Schedule This" button).
In the Setup Scheduled Report window, choose the vehicle, group, or hierarchy you want to include in the report.
Modify the Schedule (frequency) to "Daily" or "Weekly."
Modify the Email Subject as needed.
Enter the email address(es) of the person(s) who should receive the report.
Choose to add Stop Duration, Non-Reporting, or Voltage Below parameters. If you choose one of these items, only the vehicles that match the criteria will be included in the report. If you choose MORE than one of these options, the system treats them as "AND" operators. In the example below, we chose two options (i.e., stopped for five days AND non-reporting for two days), which means both of those requirements must be true for a vehicle to be included in the report.
Choose your sort preference for how you want data to be grouped in the report. We chose "Reported."
Leave the defaults selected for Email Body, Attachments, and Active settings.
Click Schedule Report.
When the report is delivered, you can immediately identify any vehicle that has not reported for a number of days and further investigate the cause. Click the last reported time to open the vehicle's Activity Detail report:
Use the Activity Detail report to see an overview of each update for a selected vehicle. It includes a Voltage column so you can see the battery level at each report point to help identify vehicles with battery issues. You can see the longer a vehicle is parked without running, the lower the battery level drops. This report is also useful should you need to do troubleshooting; it’s a first step your team can use before calling Support.
[post_title] => How do I proactively detect device issues?
[post_excerpt] => We just completed implementation, and things are running along smoothly. What advice do you have for issue prevention and detection?
[post_status] => publish
[comment_status] => closed
[ping_status] => closed
[post_password] =>
[post_name] => how-do-i-proactively-detect-device-issues
[to_ping] =>
[pinged] =>
[post_modified] => 2024-07-26 07:48:27
[post_modified_gmt] => 2024-07-26 14:48:27
[post_content_filtered] =>
[post_parent] => 0
[guid] => http://gpsihelp.wpengine.com/?post_type=deepdive&p=892
[menu_order] => 0
[post_type] => deepdive
[post_mime_type] =>
[comment_count] => 0
[filter] => raw
)
)
[post_count] => 1
[current_post] => -1
[before_loop] => 1
[in_the_loop] =>
[post] => WP_Post Object
(
[ID] => 892
[post_author] => 12
[post_date] => 2016-01-12 18:04:13
[post_date_gmt] => 2016-01-13 01:04:13
[post_content] =>
Question:
We just completed implementation, and things are running along smoothly. What advice do you have for issue prevention and detection? I don't want to run a report a year from now and discover too late that one of my devices stopped reporting six months earlier.
Yes! You already have a proactive mindset, so the rest of the process is easy. Once you identify whom should be notified of device health and device maintenance issues, the portal can help you do the rest. Here are some recommended approaches that new customers can use for issue prevention and detection.
Low Battery Detection
A switch alert for battery voltage will trigger when voltage on the red wire (constant power) drops below 11.8V for more than 30 minutes. In that case, the vehicle should be started as soon as possible to avoid dead vehicle battery. If an alert is triggered for a vehicle that has only been sitting for a short period of time, there is a good indication the battery in the vehicle is weak, or something else in the vehicle is drawing an excessive amount of power when the vehicles is off.
To set up a Switch Alert for Battery Voltage:
From the Account menu, click Manage Alerts, and then click Open.
On the Alerts page, click New Switch Alert (green plus sign )
In the New Alert window, choose the vehicle or group you want to monitor.
Modify the Alert Subject to "Battery Low."
Enter the email address(es) and SMS number(s) of the person(s) who should receive the alert.
Choose whether or not to notifiy the driver with a custom message when the alert is triggered.
If available, chose whether or not to have the in-cab notification and the notification type trigger.
In the Switch Type area, choose the option for Battery Voltage.
Set your parameters for Weekdays and Weekends.
Set landmark preference parameter.
If you would like the alert to send notification once then deactivate, check the box next to this option. We recommend not selecting this option for this type of alert.
Leave the defaults set for Repeat Delay, Per-Vehicle Delay, and Active settings.
Click Create New Alert.
You can also investigate low battery issues per vehicle in the Activity Detail Report using the Voltage column. For example, you may notice that a vehicle continues to trigger the battery voltage. The report can show whether that vehicle is frequently left parked for extended periods of time.
If your device includes a backup battery, the switch alert for external power lost will trigger when the tracking device goes from receiving power via the red wire (constant power) to receiving power via the internal device battery. This event may occur when a vehicle has a dead battery or when a device has been removed (possible tampering).
To set up a Switch Alert for External Power Lost:
From the Account menu, click Manage Alerts, and then click Open.
On the Alerts page, click New Switch Alert (green plus sign )
In the New Alert window, choose the vehicle or group you want to monitor.
Modify the Alert Subject to "External Power Lost."
Enter the email address(es) and SMS number(s) of the person(s) who should receive the alert.
Choose whether or not to notifiy the driver with a custom message when the alert is triggered.
In the Switch Type area, choose the option for External Power Lost.
Set your parameters for Weekdays and Weekends.
Set landmark preference parameter.
If you would like the alert to send notification once then deactivate, check the box next to this option. We recommend not selecting this option for this type of alert.
Leave the defaults set for Repeat Delay, Per-Vehicle Delay, and Active settings.
Click Create New Alert.
Performance Check
The Performance Report shows how long vehicles have been stopped the last time the device reported. To proactively monitor devices, schedule this report daily or weekly and sort by “Days Stopped” and “Last Reported” to quickly identify vehicles that need attention.
To schedule a Performance Report:
From the Account menu, click Manage Reports, and click Open.
The Scheduled Reports page opens in a new browser tab.
From the Report List grid, click New Scheduled Report (green plus sign ) next to the Performance Report.
You can also invoke a new scheduled report from within an existing report window ("Schedule This" button).
In the Setup Scheduled Report window, choose the vehicle, group, or hierarchy you want to include in the report.
Modify the Schedule (frequency) to "Daily" or "Weekly."
Modify the Email Subject as needed.
Enter the email address(es) of the person(s) who should receive the report.
Choose to add Stop Duration, Non-Reporting, or Voltage Below parameters. If you choose one of these items, only the vehicles that match the criteria will be included in the report. If you choose MORE than one of these options, the system treats them as "AND" operators. In the example below, we chose two options (i.e., stopped for five days AND non-reporting for two days), which means both of those requirements must be true for a vehicle to be included in the report.
Choose your sort preference for how you want data to be grouped in the report. We chose "Reported."
Leave the defaults selected for Email Body, Attachments, and Active settings.
Click Schedule Report.
When the report is delivered, you can immediately identify any vehicle that has not reported for a number of days and further investigate the cause. Click the last reported time to open the vehicle's Activity Detail report:
Use the Activity Detail report to see an overview of each update for a selected vehicle. It includes a Voltage column so you can see the battery level at each report point to help identify vehicles with battery issues. You can see the longer a vehicle is parked without running, the lower the battery level drops. This report is also useful should you need to do troubleshooting; it’s a first step your team can use before calling Support.
The Camera Media page in the Fleet Tracking Portal is designed to provide a centralized and focused repository of camera video clips from Driveri, Drive360, and AIR II cameras. Camera event clips are plotted on the map and you can access metadata about the vehicle’s behavior reported during the media clip’s timeframe. Note: You must have…
The Portal interface is quick, simple, and highly configurable. With just a few clicks, you can run any report or view the map for a single vehicle, a group of vehicles, or your entire fleet. Schedule reports, set up alerts, or administer your vehicle, driver, and user groups easily from our efficient web-based interface. Enterprise…
Welcome to Fleet Tracking! An account has been created for you and it’s time to log in to your Fleet Tracking Portal to check out your new software tool. Welcome Email After an account has been created for you, you will receive an email from Support with the subject line “Welcome! Let’s get started.” This…
In this video, we’ll explore the resources the Explore page has to offer. Since the making of this video the Homepage has been renamed to the Explore page.
I noticed three different speed values on my report (Max, Avg, and Inst). How are each of those calculated, and why doesn't the system use the vehicle speed from my engine's computer if diagnostics are supported?


 ).


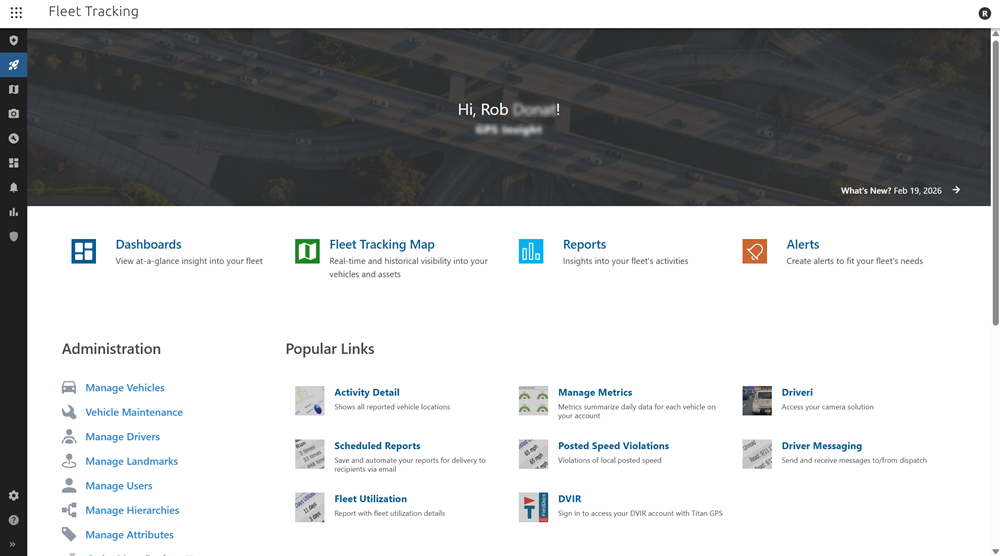
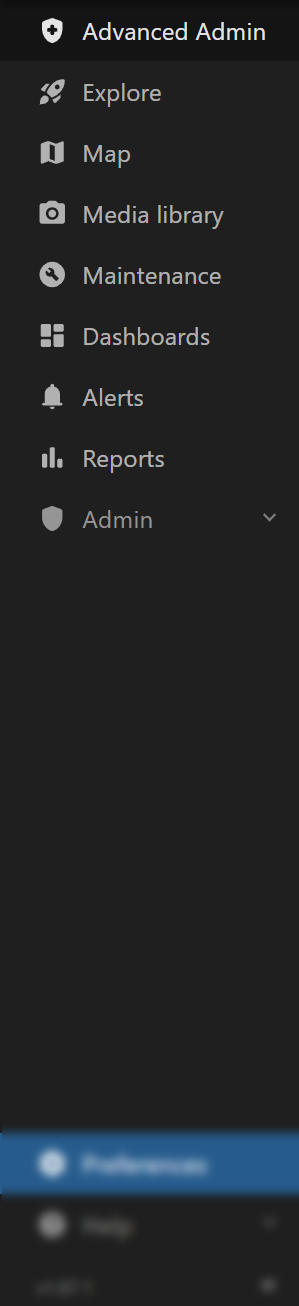

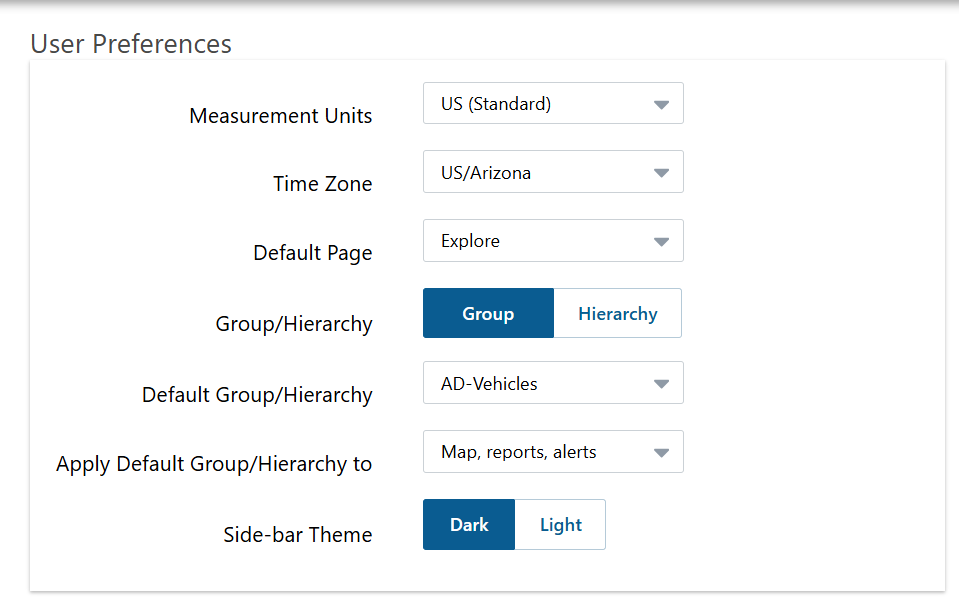
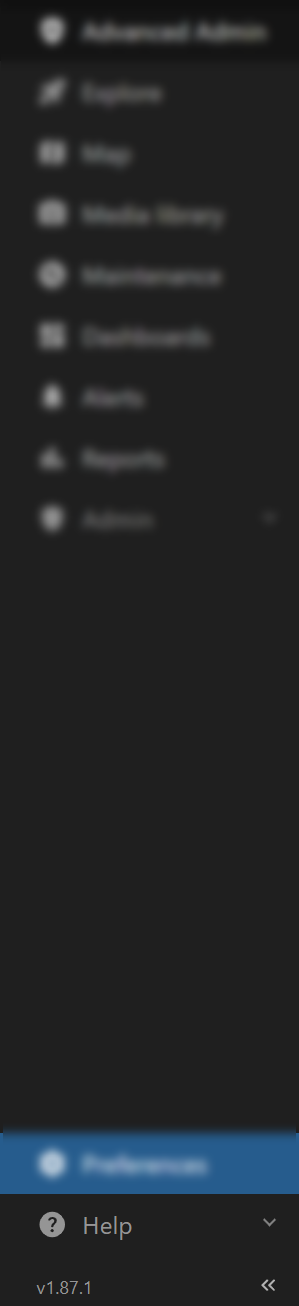


 ).


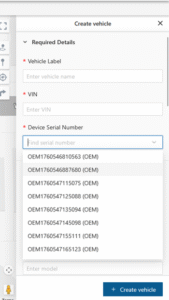


 The Passwordless login form appears.


 A browser tab opens and a pop-up message asks if you'd like to stay signed in.


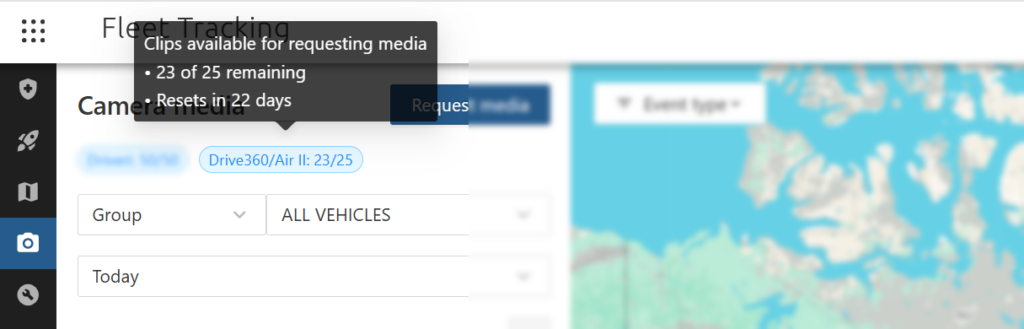
 A GPS unit receives data from GPS satellites that orbit 12,000 miles above the earth. There are 24+ GPS satellites orbiting the earth at any one time. GPS satellites send satellite location, time, and satellite health information using standard radio frequencies. The GPS unit picks up these radio frequencies, and calculates its location based on triangulation between at least three satellites. This calculation is heavily dependent on time information sent by the satellite, as the time between transmission and receiving of the signal is what is used to determine the distance of the satellite. The GPS unit communicates telematics data to GPS Insight using the cellular network based on the reporting interval for which it is programed.
 After the GPS unit receives information from all satellites within range, the unit calculates the latitude and longitude of the GPS unit. The GPS unit is normally accurate to within two meters Circular Error Probability (CEP), and the accuracy is further increased through algorithms built into [whitelabel_name]. Analysis of the GPS information provided by [whitelabel_name] yields an accuracy rate of approximately 99.88%. In most cases, inconsistencies and erroneous data elements come from a single incorrect reading; as the sample set of data is increased, the more the more accurate and reliable the data becomes (see GPS drift). While not every erroneous piece of data is caught, there are many filters in place to find and eliminate erroneous readings.
 GPS satellites send signals to our units using radio frequencies, which are occasionally subject to interference and signal bounce off of large objects (e.g., buildings, overpasses, and mountains/natural obstructions). When our unit is close to these objects, there is a chance that the signal from the satellite will bounce off of these objects, and cause our unit to incorrectly calculate the timing of the signal, which will affect the unit's calculation for its location. When this issue does occur, the erroneous data is usually more pronounced than what you would find with GPS drift, and you can typically isolate the cause when reviewing vehicle history (i.e, the vehicle was driving under large overpasses on freeways or traveling through large metropolitan areas surrounded by high rise buildings).
 Although this driving instance might be considered aggressive, it is hardly egregious. Whenever possible, shape your driver policies on summary data rather than calculations that are affected by single points of data, such as instant speed and g-force. For example, the Speed Summary Report can mitigate these potential inaccuracies by reviewing the data over a significant period of time, which will better identify drivers that continually trend higher with respect to speed rather than isolated instances.
 Sustained speeding (duration) is not considered.
 [/column]
[column lg="4" md="12" sm="12" xs="12" ]
During the same time period, this vehicle only had two sustained posted speed violations for a threshold of two minutes.
 The minimum driving time required to collect two consecutive inst speed values is four minutes.
 [/column]
[column lg="4" md="12" sm="12" xs="12" ]
During the same time period, this vehicle only had one sustained posted speed violation for a threshold of four minutes.
 The minimum driving time required to collect four consecutive inst speed values is eight minutes.
 [/column]
[/row]
[post_title] => How does my device report speed?
[post_excerpt] => I noticed three different speed values on my report (Max, Avg, and Inst). How are each of those calculated, and why doesn't the system use the vehicle speed from my engine's computer if diagnostics are supported?
[post_status] => publish
[comment_status] => closed
[ping_status] => closed
[post_password] =>
[post_name] => how-does-my-device-report-speed
[to_ping] =>
[pinged] =>
[post_modified] => 2023-04-11 12:31:16
[post_modified_gmt] => 2023-04-11 19:31:16
[post_content_filtered] =>
[post_parent] => 0
[guid] => http://gpsihelp.wpengine.com/?post_type=deepdive&p=1463
[menu_order] => 0
[post_type] => deepdive
[post_mime_type] =>
[comment_count] => 0
[filter] => raw
)
)
[post_count] => 2
[current_post] => -1
[before_loop] => 1
[in_the_loop] =>
[post] => WP_Post Object
(
[ID] => 878
[post_author] => 12
[post_date] => 2016-01-11 18:39:25
[post_date_gmt] => 2016-01-12 01:39:25
[post_content] =>
 After the GPS unit receives information from all satellites within range, the unit calculates the latitude and longitude of the GPS unit. The GPS unit is normally accurate to within two meters Circular Error Probability (CEP), and the accuracy is further increased through algorithms built into [whitelabel_name]. Analysis of the GPS information provided by [whitelabel_name] yields an accuracy rate of approximately 99.88%. In most cases, inconsistencies and erroneous data elements come from a single incorrect reading; as the sample set of data is increased, the more the more accurate and reliable the data becomes (see GPS drift). While not every erroneous piece of data is caught, there are many filters in place to find and eliminate erroneous readings.


 Use the following link to learn how to install your device:

 We recommend you check out the following links to increase your knowledge:
[/solution][solution term="pro,enterprise"][video width="1280" height="720" mp4="https://help.gpsinsight.com/wp-content/uploads/2019/01/pro-ent_getting-started_final.mp4"][/video]

 We recommend you check out the following links to increase your knowledge:
 [/column]
[column lg="4" md="4" sm="4" xs="4" ]


 )